Are you the type of person that likes your code to be identically indented? for spacing to be consistent throughout your script, everything to be clear and aligned, read easily and just look nice? Well, I am. Often I get tremendously untidy code from other coders (those bandits), and it takes me way too much time to understand where this for loop starts, where that function ends etc. Reading this code gets especially confusing if the person for example uses nested for loops (for loop inception - a for in a for in a for…). Well I came across a package in R that eliminated this problem all together, called formatR - see https://cran.r-project.org/web/packages/formatR/index.html. To illustrate how this package works, I use a section of code from Prof Hedibert Freitas Lopes, found here: http://hedibert.org/wp-content/uploads/2014/06/Application2-stochasticvolatility-R.txt. Now if you’ve ever seen the code Prof Lopes (gratuitously) posts, you’ll know it’s very neat. So to illustrate how the formatR works, I mess it up a bit, playing with the spaces and the indentation. Below is the resulting code.
    rm(list=ls())

            getindex = function(x){c(x[1+x[1]],x[8+x[1]])}

  ldt = function(x,nu,m,sd){dt((x-m)/sd,nu,log=TRUE)-log(sd)}

        LW = function(y,alphas,betas,tau2s,xs,delta){n  = length(y)
N  = length(xs)
  quants = array(0,c(n,4,3))
    h2 = 1-((3*delta-1)/(2*delta))^2
        a  = sqrt(1-h2)
  pars = cbind(alphas,betas,log(tau2s))
  like = rep(0,n)
  for (t in 1:n){like[t] = sum(dnorm(y[t],0.0,exp(xs/2)))
    # Resampling
    mus     = pars[,1]+pars[,2]*xs
    mpar    = apply(pars,2,mean)
           vpar    = var(pars)
    ms      = a*pars+(1-a)*matrix(mpar,N,3,byrow=T)
    weight  = dnorm(y[t],0.0,exp(mus/2),log=TRUE)
weight1 = exp(weight-max(weight))
    k       = sample(1:N,size=N,replace=T,prob=weight1)
    # Propagating
    if (delta<1){ms1 = ms[k,]+matrix(rnorm(3*N),N,3)%*%chol(h2*vpar)}else{ms1 = ms}
    xt   = rnorm(N,ms1[,1]+ms1[,2]*xs[k],exp(ms1[,3]/2))
       w    = dnorm(y[t],0.0,exp(xt/2),log=TRUE)-weight[k]
    w    = exp(w-max(w))
ind  = sample(1:N,size=N,replace=T,prob=w)
    xs   = xt[ind]
          pars = ms1[ind,]
    # Storing quantiles
    quants[t,1,] = quantile(pars[,1],c(0.5,0.025,0.975))
quants[t,2,] = quantile(pars[,2],c(0.5,0.025,0.975))
        quants[t,3,] = quantile(exp(pars[,3]),c(0.5,0.025,0.975))
    quants[t,4,] = quantile(exp(xs/2),c(0.5,0.025,0.975))
  }
  return(list(like=like,quants=quants))
}
As you can see, while it’s easy to spot out a function here and there and a for loop, it’s really difficult to quickly read and see where a bracket begins and where it ends. Now to solve this, we firstly load the formatR package and then get ready to use the function tidy_source(). To obtain the cleaned code, we simply copy the section of code we’d like to format, and then merely run the tidy_source() function, adapting the parameters as we choose. Some of these parameters include width_cutoff which determines when a link-break is inserted, comment and blank which determines whether or not to purge comments and blank lines and arrow, which if set to true, replaces all = with <-.
library(formatR)
tidy_source(source = "Messy_Code.R", width.cutoff = 70, comment = T, blank = T,
            arrow = T)
tidy_source then spits out the cleaned, formatted code in the console, ready for you to copy into you new cleaned and formatted script, as you can see below. Pretty cool hey?
rm(list = ls())

getindex <- function(x) {
    c(x[1 + x[1]], x[8 + x[1]])
}

ldt <- function(x, nu, m, sd) {
    dt((x - m)/sd, nu, log = TRUE) - log(sd)
}

LW <- function(y, alphas, betas, tau2s, xs, delta) {
    n <- length(y)
    N <- length(xs)
    quants <- array(0, c(n, 4, 3))
    h2 <- 1 - ((3 * delta - 1)/(2 * delta))^2
    a <- sqrt(1 - h2)
    pars <- cbind(alphas, betas, log(tau2s))
    like <- rep(0, n)
    for (t in 1:n) {
        like[t] <- sum(dnorm(y[t], 0, exp(xs/2)))
        # Resampling
        mus <- pars[, 1] + pars[, 2] * xs
        mpar <- apply(pars, 2, mean)
        vpar <- var(pars)
        ms <- a * pars + (1 - a) * matrix(mpar, N, 3, byrow = T)
        weight <- dnorm(y[t], 0, exp(mus/2), log = TRUE)
        weight1 <- exp(weight - max(weight))
        k <- sample(1:N, size = N, replace = T, prob = weight1)
        # Propagating
        if (delta < 1) {
            ms1 <- ms[k, ] + matrix(rnorm(3 * N), N, 3) %*% chol(h2 * vpar)
        } else {
            ms1 <- ms
        }
        xt <- rnorm(N, ms1[, 1] + ms1[, 2] * xs[k], exp(ms1[, 3]/2))
        w <- dnorm(y[t], 0, exp(xt/2), log = TRUE) - weight[k]
        w <- exp(w - max(w))
        ind <- sample(1:N, size = N, replace = T, prob = w)
        xs <- xt[ind]
        pars <- ms1[ind, ]
        # Storing quantiles
        quants[t, 1, ] <- quantile(pars[, 1], c(0.5, 0.025, 0.975))
        quants[t, 2, ] <- quantile(pars[, 2], c(0.5, 0.025, 0.975))
        quants[t, 3, ] <- quantile(exp(pars[, 3]), c(0.5, 0.025, 0.975))
        quants[t, 4, ] <- quantile(exp(xs/2), c(0.5, 0.025, 0.975))
    }
    return(list(like = like, quants = quants))
}
The formatR package also contains some other functions like tidy_dir(), which formats all of the the scripts in a directory. In this case, it doesn’t spit the code out in the console, instead overwriting the original R scripts with the cleaned data.
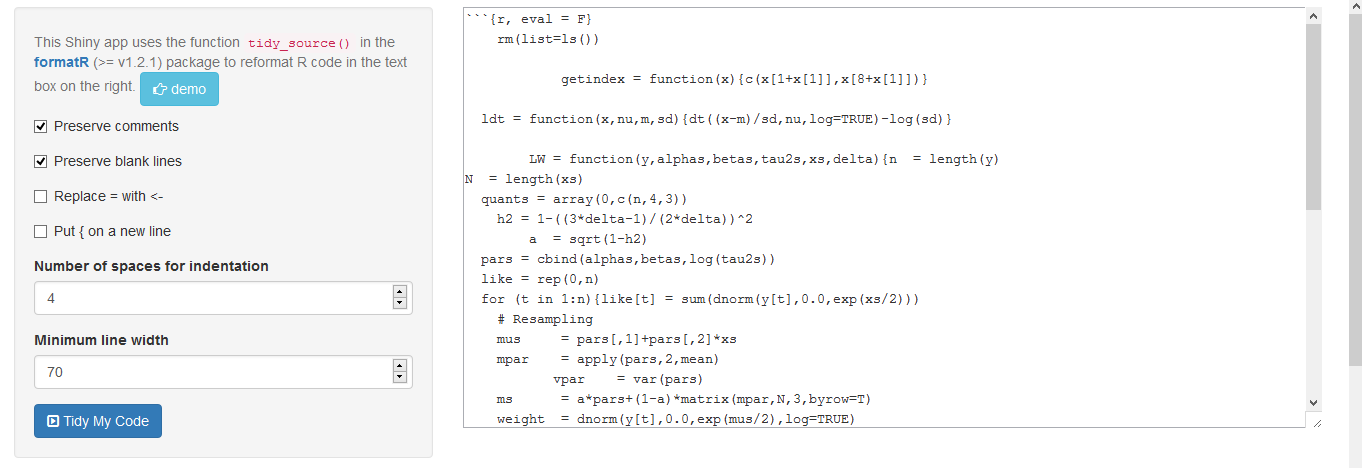
My favorite function however has to be tidy_app. This function when run, opens up a Shiny app which allows you to format your code. Here you simply paste your code in the window, choose you format settings on the left, press Tidy my Code and voila, your cleaned and formatted code appears in the window, ready to copy and use.
While this is nothing groundbreaking (Although personally, I find the Shiny app pretty cool), I still believe it to be a really useful package which should help keep all of your code consistent in appearance, thereby making it easier for your peers/colleagues to understand, and vice-versa.